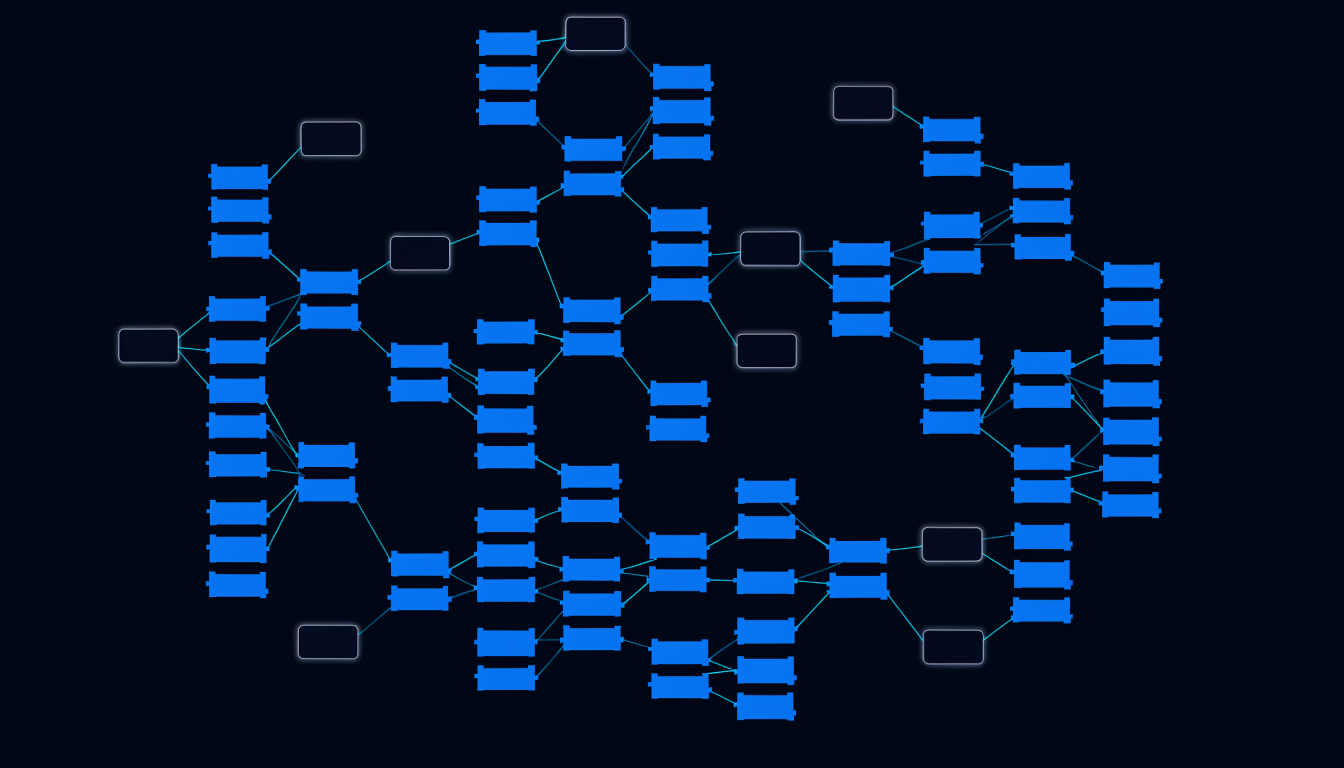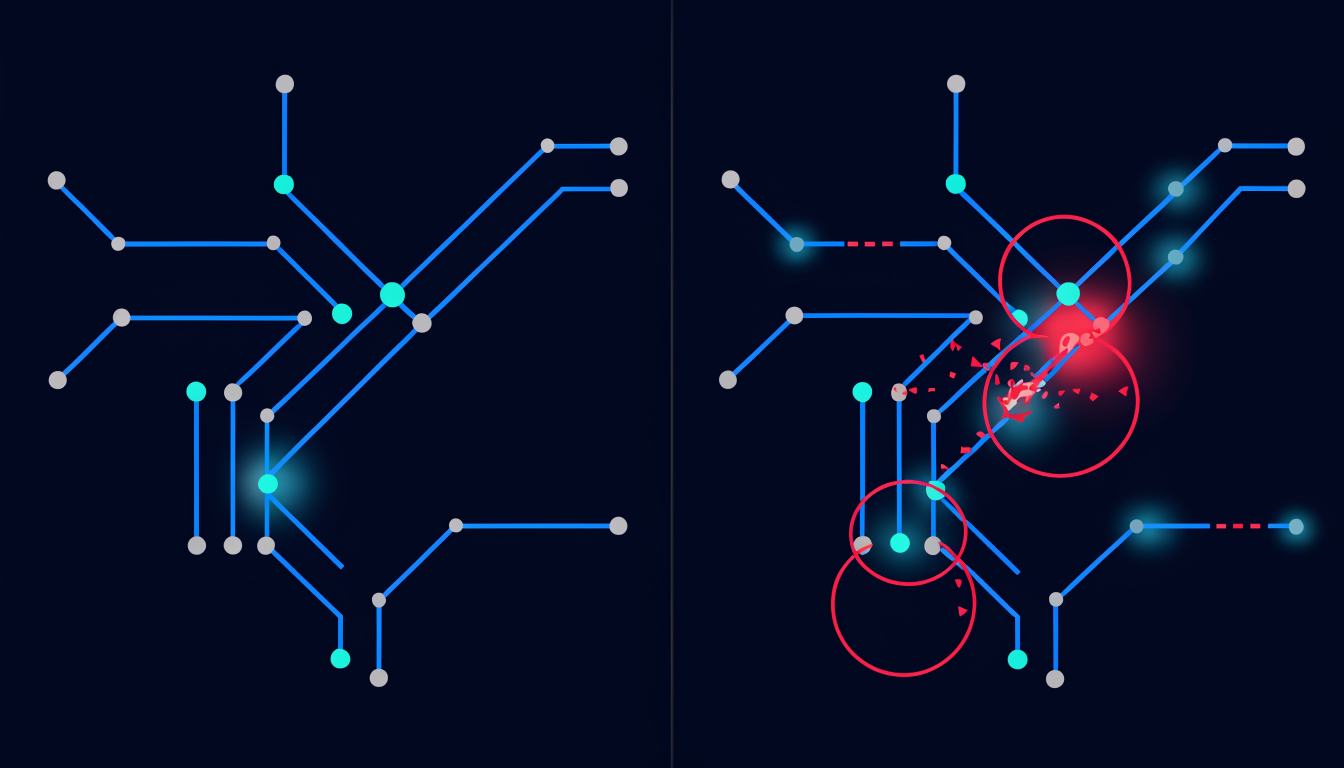
The competitive landscape for context layers has consolidated around two approaches. The first is the graph without scoring: build an accurate map of the dependency graph and expose it to the AI. The second is the scored graph: build the same map, then rank every node by multiple structural significance metrics before exposing it.
The difference between these two approaches is not a feature. It is the difference between information and intelligence.
The unscored graph problem
An unscored dependency graph gives your AI accurate information: "file A imports file B, file C imports file A, there are 1,247 nodes and 4,382 edges." This information is correct and complete.
It is also largely unusable for reasoning about risk.
When an AI receives a 1,247-node graph with no ranking, it has two options: ignore most of it (attention is limited) or try to reason about all of it (computationally expensive, and the model has no principle for prioritisation). In practice, the model applies its own heuristics, file name patterns, import count proxies, recency signals, which are approximately correct and systematically wrong for the cases that matter most (blindspot files, community-bridging keystones).
What scoring adds
Scoring answers the questions the unscored graph cannot:
- "Which files are structurally most important in this codebase?" (spikescore)
- "Which files look minor but actually reach far?" (blindspot score)
- "Which files are load-bearing in their community?" (webscore)
- "What is the blast radius of a change to this file?" (pre-computed reachability)
- "Which communities exist, and where are the boundaries?" (Leiden partition)
These answers are not derivable from the edge list alone. They require computation across the full graph topology, a class of analysis that runs once at brain-construction time and is then served as structured, queryable data.
The OSS tool gap
The most-used open-source dependency tools, madge, dependency-cruiser, ts-morph graph extractors, produce accurate edge lists and stop there. None of them compute spikescore, blindspot score, community partition, or pre-computed blast radius. Some visualise the graph; none of them rank it.
This is not a criticism of these tools. They are doing exactly what they were designed to do: give engineers a visual representation of their dependency graph. They were not designed to serve an AI agent as a decision-making resource.
The "flat graph + LLM" gap
Several more recent tools attempt to close this gap by ingesting the dependency graph into an LLM and letting the model reason about importance. This approach has two problems:
Cost: reasoning about a 1,000-node graph costs significant context tokens every time the AI is asked a structural question. Scoring the graph once and caching the results costs a fraction of that per query.
Consistency: a language model reasoning about graph importance will give different answers on different runs. "What are the top 10 most important files in this codebase?" asked twice may return two different lists. A deterministic spikescore ranking returns the same list every time.
Consistency is not just an aesthetic concern. For CI gating, for blast-radius-gated deploy pipelines, for team-wide structural conventions, you need answers that are stable across environments, engineers, and time. Probabilistic reasoning cannot provide this.
The two skeptic arguments
Skeptic A: "An OSS dependency grapher does this for free."
OSS graphers show how files connect. Spiderbrain shows which connections will hurt, the difference between a subway map and a map with the broken tracks circled. The scoring layer, webscore, spikescore, blindspot, does not exist in any OSS dependency visualiser (verified: madge, dependency-cruiser, graphkit variants, arkit, depcruise-extension set).
Skeptic B: "My AI’s long context window makes graph tools irrelevant."
Larger context windows do not improve structural reasoning about graphs. The token budget required to include all the files in a 200-file blast radius exceeds any practical context window. More importantly, context-stuffing degrades model attention quality, the "lost in the middle" finding holds across frontier models.
Scoring is the alternative to context-stuffing: instead of including everything, include a ranked selection. The scored graph enables this selection. The unscored graph does not.
The practical question
When evaluating a context layer, the question to ask is not "does it build a graph?" Every tool that does anything structural builds some form of graph. The question is: "does it rank the graph, and are those rankings deterministic, queryable, and stable across runs?"
If the answer is no, if the tool gives you a map and asks the AI to reason about importance, you have information, not intelligence. For structural decisions in production engineering, the distinction is the gap between a tool you can build workflows on and a tool you can only browse.