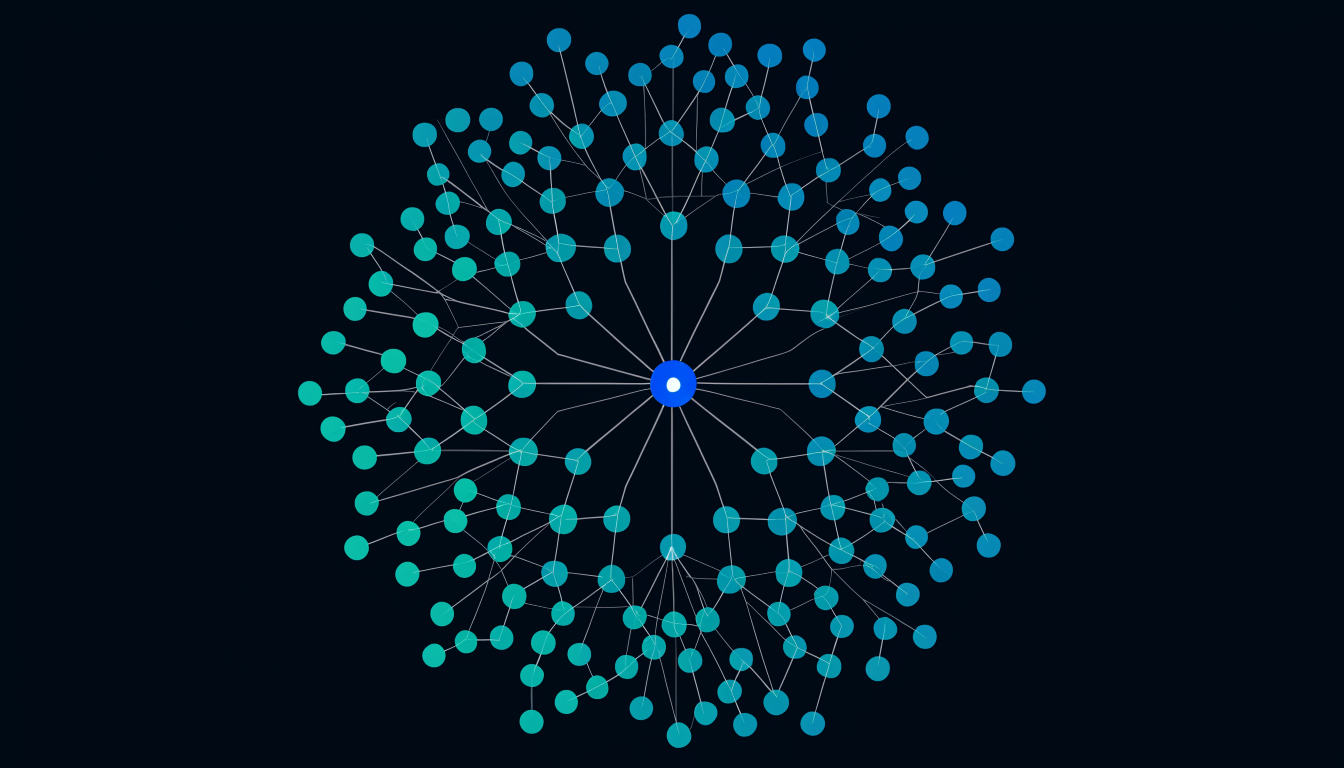
There are at least a dozen open-source tools that will draw your codebase as a graph. Some of them are genuinely good at it. They map import edges, call edges, and type dependencies with accuracy and reasonable performance. A few will even export the graph as JSON and dump it into your AI’s context window.
None of them tell you which nodes matter.
This is the missing layer, and the reason why "we have a dependency graph" does not translate into "our AI agent makes better decisions."
The subway map problem
A dependency graph without scoring is a subway map without delay indicators. All the stations are there. All the connections are accurate. But if you need to know whether changing a node will cascade, or which node is the structural keystone for its community, or which file looks minor but reaches 40% of the codebase, the map gives you nothing.
Scoring turns the map into an operational instrument.
The three scores
Spiderbrain computes three structural scores for every node in the graph:
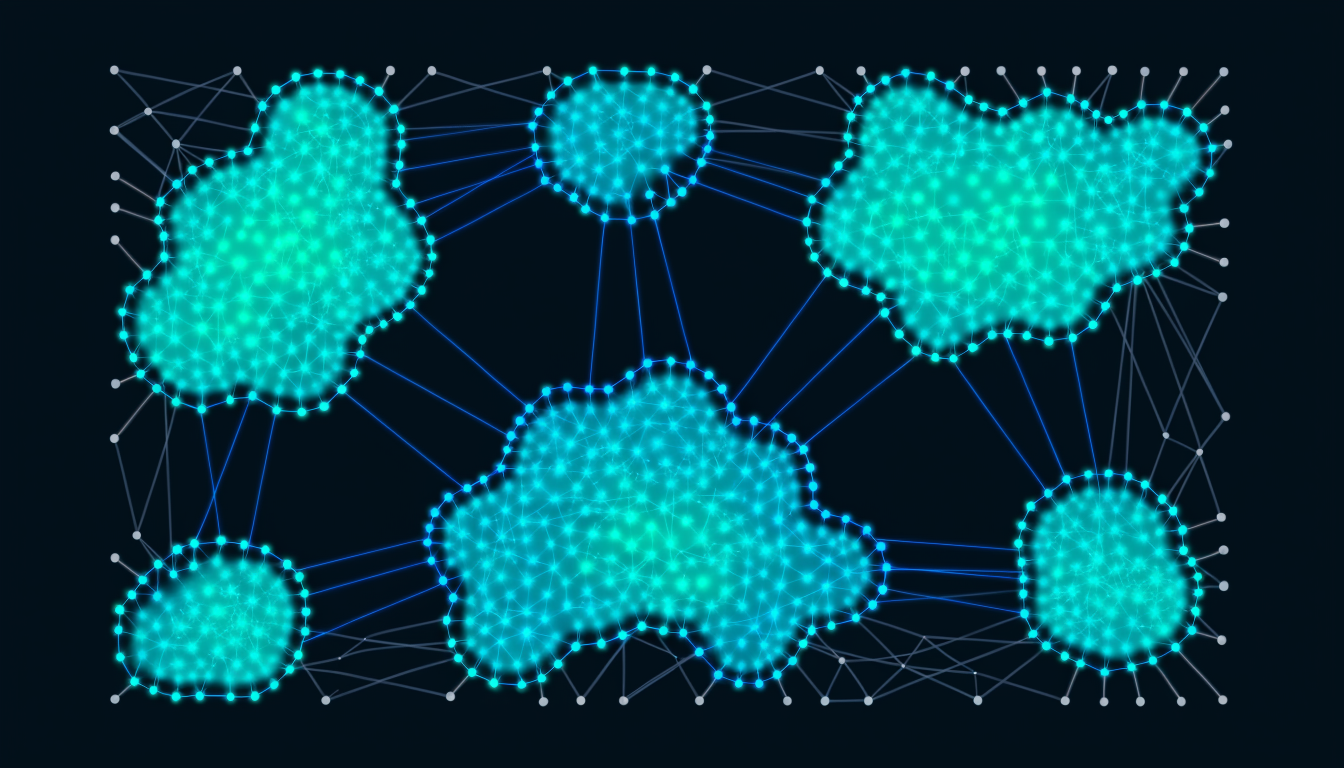
Webscore measures the node’s structural significance within its community, the tightness of its coupling to the nodes around it. A high-webscore node is a community anchor: other nodes depend on it, it appears on critical paths, and its removal would fragment the community.
Spikescore is the graph-wide ranking: which nodes, if removed, would most damage the structural integrity of the entire codebase? These are the keystones, not necessarily the most-imported nodes, but the nodes that sit at the intersection of communities, bridge clusters, and whose blast radius is both wide and deep.
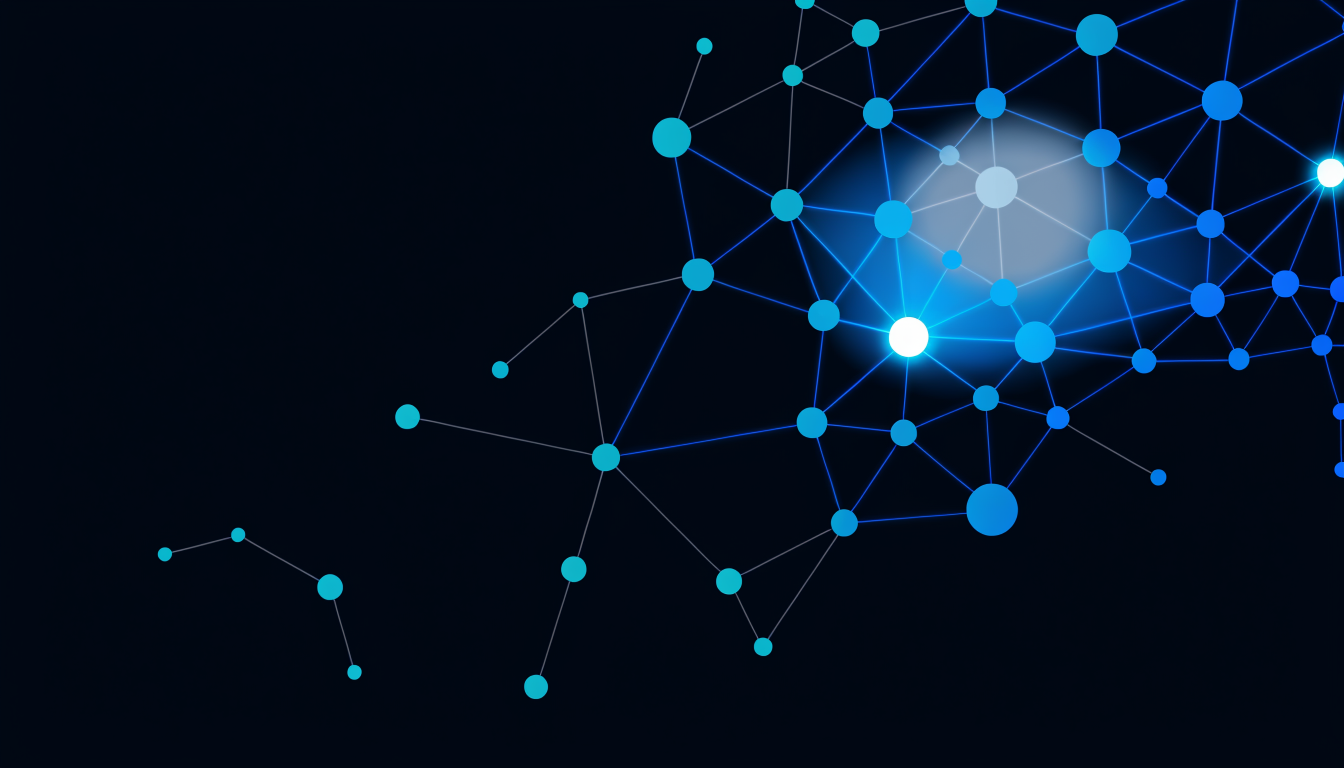
Blindspot score inverts the usual centrality metric. It finds nodes with apparently low in-degree but high transitive out-reach, files that look like leaf nodes but actually connect to a large structural surface through indirect paths. These are the files that reviewers skip because they look small and that AI agents underrate because they appear isolated.
Why all three are necessary
Each score finds a different failure mode:
Webscore finds the community load-bearers, the files whose modification needs cross-community coordination. Missing a high-webscore node in a code review means missing a coordination point.
Spikescore finds the systemic keystones, the files where a production incident is most expensive. These are the nodes worth the most defensive investment (test coverage, documentation, change gating).
Blindspot score finds the invisible high-reach files, the ones that appear in no "important files" list but routinely appear in incident post-mortems as "we didn’t realise it was connected to that."
A flat graph gives your AI 1,000 nodes with no ranking. A scored graph gives your AI the 12 that matter, ranked by the specific failure mode you’re reasoning about.
The practical gap with OSS tools
The most-used OSS dependency visualisers, madge, dependency-cruiser, graphkit variants, produce accurate maps and stop there. They have no concept of structural importance within the graph. A node with 100 importers and a node with 1 importer look identical except for the number on the edge.
Spiderbrain’s scoring layer was built specifically because this gap exists. The engine computes all three scores at brain-construction time, persists them, and makes them queryable via the MCP tool surface. Your AI can ask "what are the top-10 spikescore nodes in this codebase?" and get a ranked, actionable list, not a raw edge dump.
Scoring is what makes the graph useful to an AI agent
An AI agent given a flat dependency graph has no way to reason about it selectively. It either ignores it (not enough context to make sense of 1,000 nodes) or hallucinates importance based on naming heuristics.
An AI agent given a scored graph has a selection principle: start with the top spikescore nodes, surface any high-blindspot files in the change scope, flag any high-webscore nodes that cross community boundaries. These are instructions a language model can follow.
Scoring is the translation layer between graph structure and AI judgment.